



User experience
LCP, INP, CLS, launch time and interaction latency.
AppsLoading improves websites, mobile apps, SaaS products, APIs, databases and cloud infrastructure using measurable performance engineering. We trace the complete request path, fix the constraints with the highest user and business impact, validate changes under load and protect the gains after release.
Visible lag can be caused by rendering, JavaScript, network waterfalls, service-to-service latency, database contention, cache misses, third-party dependencies or infrastructure saturation. We measure the whole path before changing architecture.



We create a baseline at the layers users actually touch and the layers engineering teams need to control.
LCP, INP, CLS, launch time and interaction latency.
Bundles, media, fonts, caching, rendering and main-thread work.
API latency, queues, concurrency and dependency timing.
Queries, indexes, locks, cache hit rate and connection pressure.
CPU, memory, network, autoscaling and regional placement.
Throughput, saturation, recovery and headroom under load.
Engage AppsLoading for a full performance programme or a focused bottleneck across one layer of the product.








Instead of tuning isolated components, we connect browser or app timing to APIs, dependencies, data access and infrastructure. That reveals where time is actually being spent.
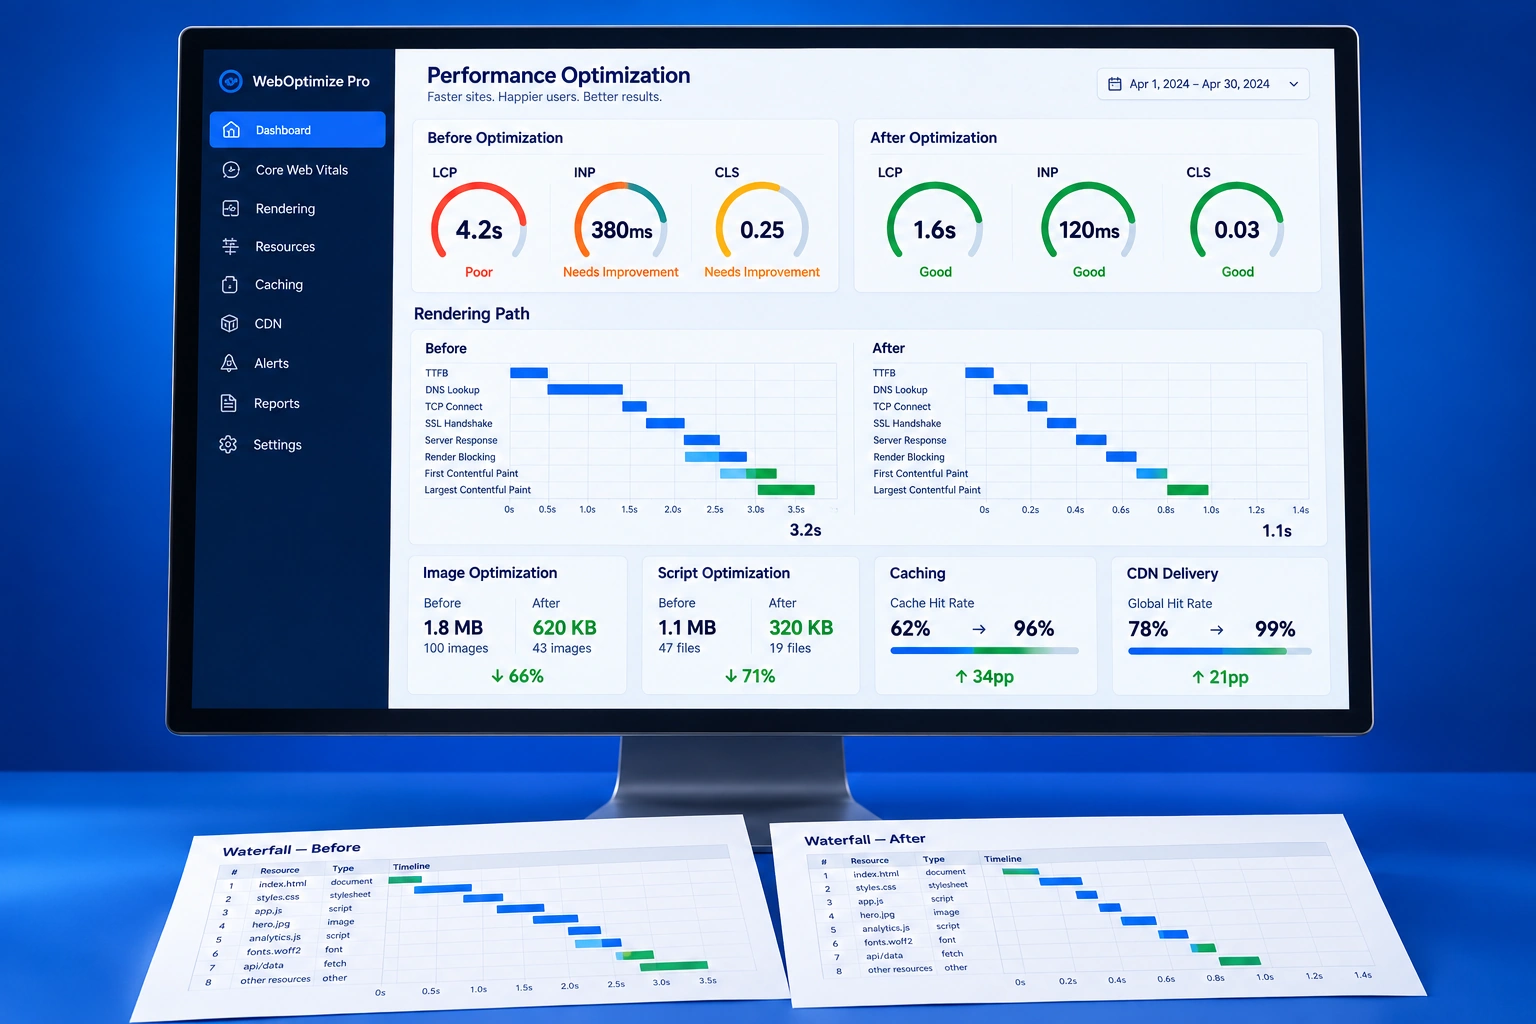
We connect CrUX or RUM evidence with lab profiling, network waterfalls and render analysis so LCP, INP and CLS work is based on the cause rather than the score alone.


We profile the main thread, JavaScript execution, layout, rendering, asset delivery and network waterfalls to remove work that users pay for on every visit.
Backend performance often hides inside serial calls, chatty services, queue delays, external dependencies, inefficient serialization and work that should happen asynchronously.


We use query plans, wait events, index analysis, connection behavior and workload patterns to improve the data path without blindly adding infrastructure.
We optimize the experience across real devices and weak networks, not only a powerful development machine.

Reduce blocking initialization, heavy startup work and unnecessary SDK setup.
Profile frames, list rendering, state updates and expensive visual work.
Find leaks, pressure, crashes and lifecycle issues across device classes.
Reduce payloads, retries, duplicate calls and slow request chains.

More compute can hide inefficient work. We separate capacity problems from architecture problems and tune the platform around actual traffic and utilization.
We design cache layers around data freshness, invalidation, personalization and failure behavior so performance gains remain correct and operationally safe.

We model realistic traffic, concurrency and business journeys to identify saturation points, queue growth, timeouts and recovery behavior.


Capacity planning connects business forecasts to throughput, concurrency, service limits, queue behavior and infrastructure resources.
Optimization is incomplete without visibility. We connect metrics, traces, logs, RUM and business events so regressions can be caught quickly.

We convert target performance into build and production guardrails so new code, scripts, media or dependencies cannot erode the gains unnoticed.

We connect technical performance improvements to measurable product and operational outcomes.
Four common performance engagements, each measured against a different set of user and system signals.

Field data, browser profiling and delivery optimization for public websites.

Rendering, API, query and background-work optimization for product interfaces.

Load testing, queues, caching, databases and cloud scaling for growth.

Budgets, RUM, traces and release checks that protect performance over time.
Start with a focused audit or run performance engineering as a recurring discipline.
Baseline, diagnosis and prioritized optimization roadmap.
Fix a defined web, API, database, mobile or cloud bottleneck.
Model traffic, test limits and improve saturation behavior.
Ongoing monitoring, budgets, regressions and optimization support.
We use the tooling that best fits the product stack and the layer being investigated.
Lab audits, rendering diagnostics and Core Web Vitals signals.
Field and lab data for critical web journeys.
Network waterfalls, filmstrips and repeatable browser testing.
APM, traces, dependencies and production performance.
Infrastructure, application, logs and distributed tracing.
Operational dashboards, metrics and alerting.
Load, stress, spike and endurance testing.
Vendor-neutral traces, metrics and instrumentation.
A structured programme with evidence, priorities, controlled change and repeatable validation.
Collect field, lab, application and infrastructure metrics.
MeasureFollow slow journeys through frontend, services and data.
DiagnoseRank improvements by impact, effort, risk and dependency.
PlanImplement focused improvements across the relevant layers.
EngineerValidate latency, throughput, saturation and failure behavior.
ValidateMonitor budgets, alerts and regressions after release.
ObserveDifferent products fail differently under latency and load. We tune the measures and tests to the user journey.

Launch, rendering, memory, network and device-level responsiveness.
Frontend delivery, APIs, caching and load behavior during peaks.

Dashboards, services, queues, databases and multi-tenant capacity.
Deliverables connect technical evidence to clear priority, measurable change and long-term regression protection.
Field, lab, application and infrastructure metrics before optimization.
Evidence-backed root causes across the full request path.
Changes ranked by impact, effort, risk and dependency.
Approved frontend, backend, data, mobile and cloud changes.
Before-and-after results plus load and regression findings.
Budgets, dashboards, alerts and ongoing review recommendations.
We treat performance as an engineering system: establish the baseline, isolate the cause, change one or more layers deliberately, validate under realistic conditions and protect the outcome.
The amount of work depends on how many layers, journeys and traffic conditions need to be measured and improved.
Website, application, mobile, APIs, database and infrastructure involved.
Existing RUM, traces, logs, metrics and profiling access.
Current load, growth expectations, seasonality and event traffic.
Services, dependencies, queues, data stores and third parties.
Core Web Vitals, latency, throughput, capacity or cost goals.
Lab testing, field measurement, load testing and ongoing monitoring.
It can include frontend speed, Core Web Vitals, API latency, database tuning, mobile performance, cloud efficiency, load testing, capacity planning and observability.
We combine field data, lab tests, profiling, traces, logs, database analysis and controlled load testing so recommendations are supported by evidence.
Timing depends on product complexity, current observability, the number of slow journeys and whether implementation and load testing are included.
Yes. We improve LCP, INP and CLS through rendering, asset, script, caching, server-response and layout changes based on field and lab evidence.
Improved Core Web Vitals, page experience, crawl efficiency and loading behavior can support the technical quality of a site.
Yes. We can profile rendering, state updates, bundles, network requests, long tasks and API dependencies in interactive applications.
Yes. We review service logic, dependencies, database access, queues, caching, timeouts, serialization and infrastructure.
Yes. We review queries, plans, indexes, schemas, locks, transactions, connections, caches and workload patterns.
Yes. We measure dependency latency and can reduce its impact through timeouts, caching, batching, asynchronous work and fallback design.
Yes. We can test concurrency, throughput, saturation, spikes, endurance, failure behavior and recovery using realistic scenarios.
Often. Removing inefficient work, improving caching, right-sizing resources and tuning scaling can reduce the cost required for the same workload.
Yes. We can model expected traffic, test critical journeys and improve capacity, caching, queues, scaling and recovery before the event.
Yes. We can optimize launch time, rendering, memory, network usage, battery-sensitive work and crash-prone or janky workflows.
Yes. We can implement dashboards, alerts, traces, RUM and performance budgets to help detect regressions after release.
You retain ownership of approved code, configuration and documentation delivered as part of the engagement according to the agreement.
Share the journeys, metrics and traffic conditions that matter. We will recommend a practical performance audit and optimization plan.
Start your performance audit →